Reporting & Analytics
Operational data only has value if you can see it clearly. Service Opus surfaces the numbers your team needs — from the main dashboard through to feature-specific analytics on leads, quotes, employee performance, and inventory — so decisions are based on what is actually happening rather than estimates and gut feel.
Analytics built into every module
- Main dashboard: operational KPIs at a glance
- Lead analytics: pipeline, conversion, and source performance
- Quote analytics: acceptance rates and value by status
- Employee performance: jobs completed, hours, workload
- Inventory reports and demand forecasting
- Schedule analytics: utilization and coverage visibility
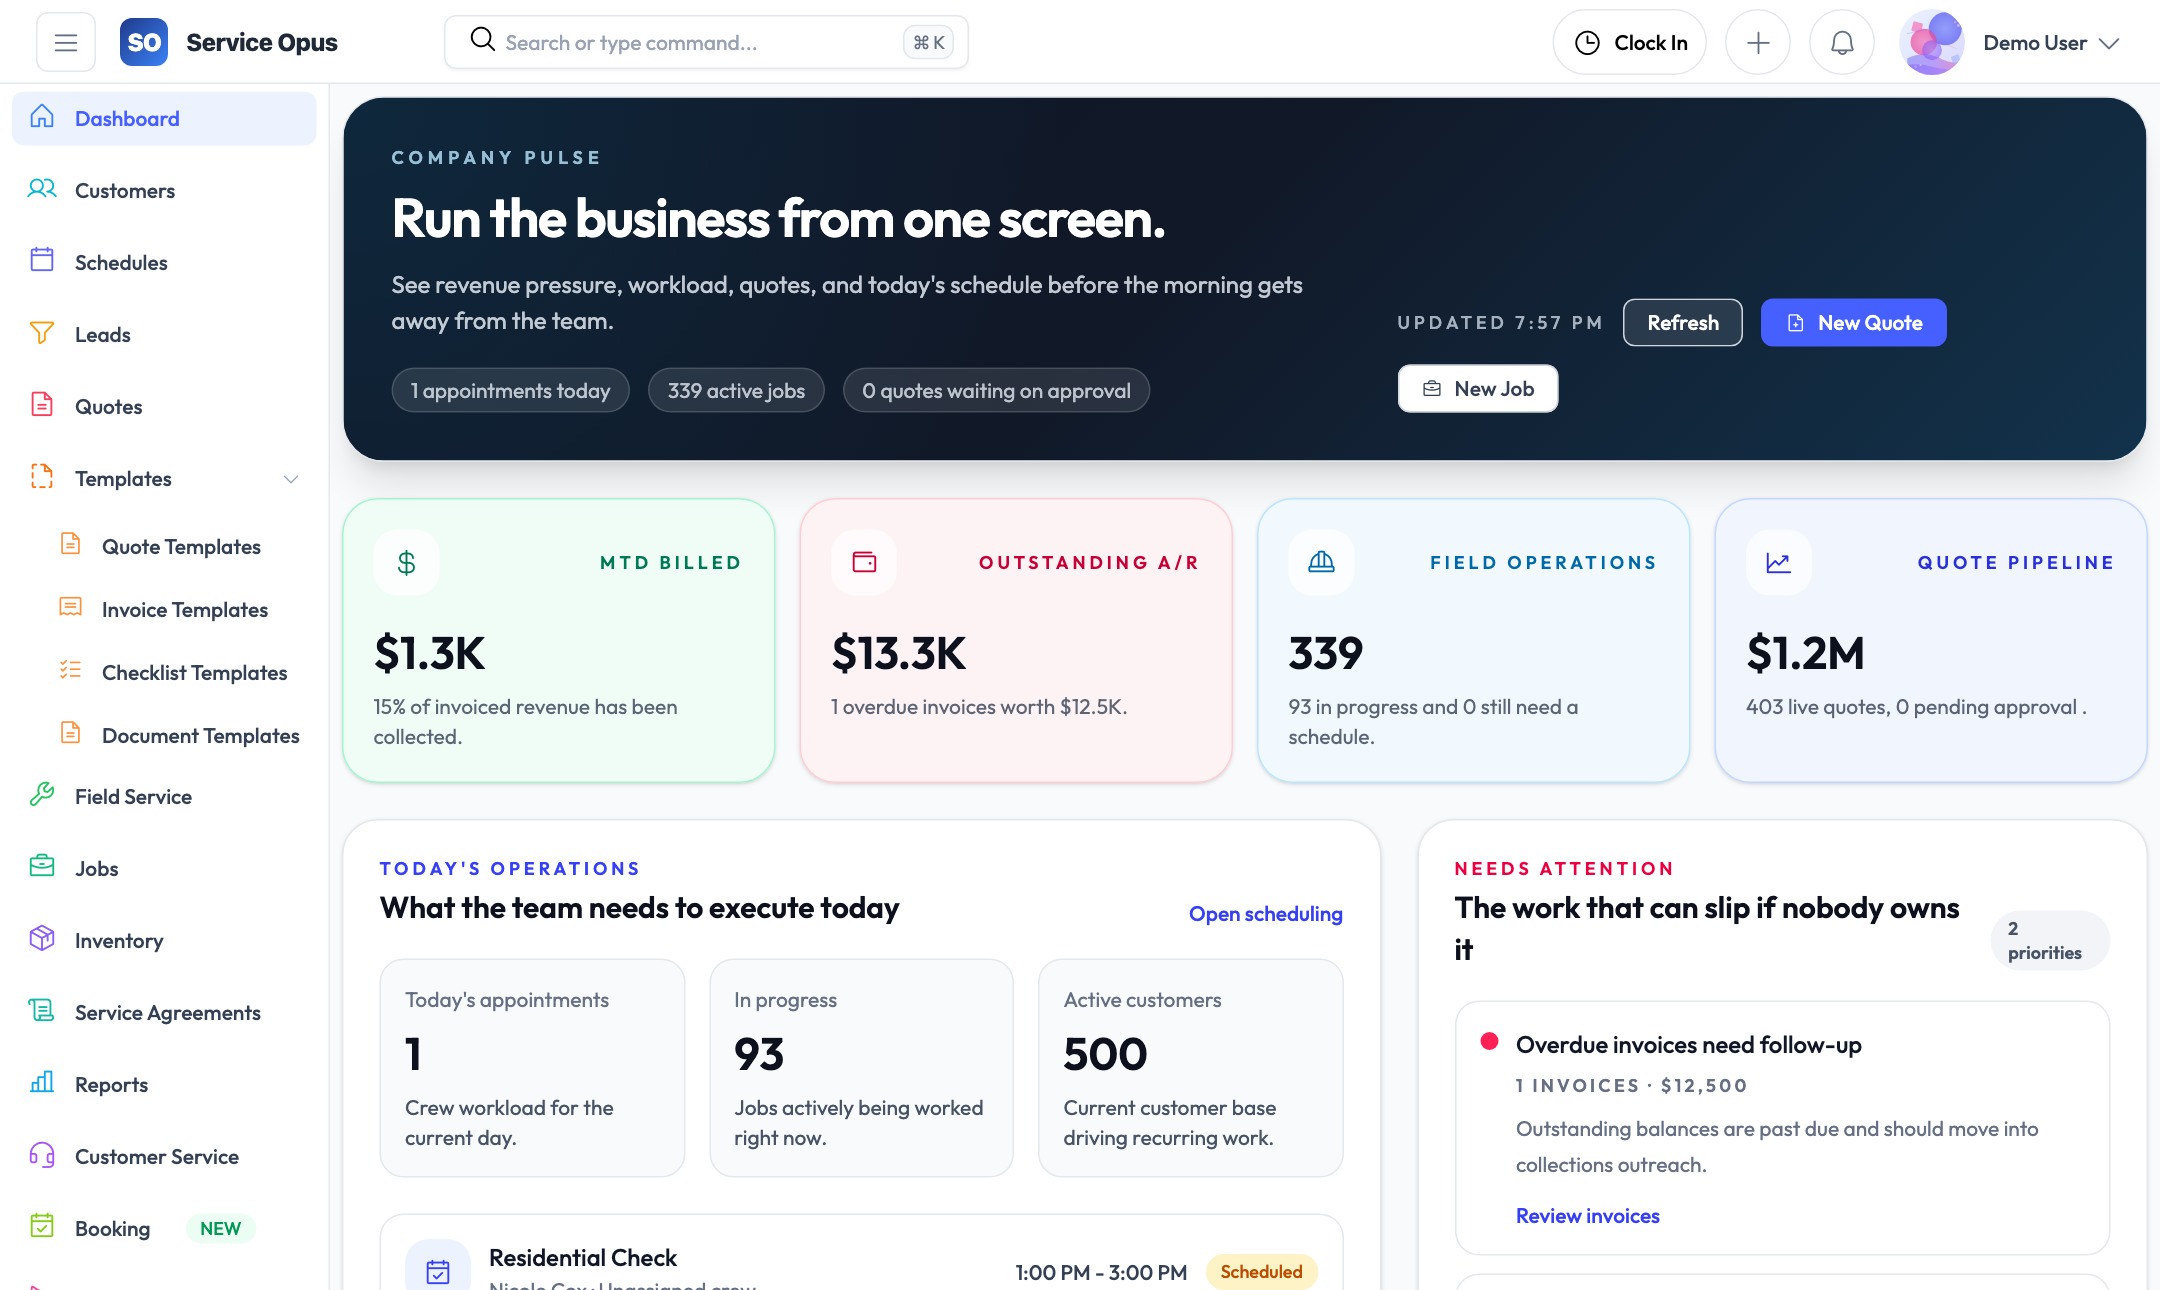
Main operational dashboard
The dashboard opens with the metrics that tell you how today is going — work in progress, upcoming jobs, outstanding invoices, and recent activity across the platform. Every team member who opens the app sees the picture relevant to their role.
At-a-glance operational metrics
The dashboard aggregates key operational numbers so you can tell at a glance whether the business is running smoothly — jobs are progressing, invoices are getting paid, and the schedule is full — without drilling into individual records.
- Jobs in progress, scheduled today, and completed this period
- Open quotes waiting for acceptance
- Outstanding invoice balances and recently paid invoices
- New leads and recent activity across the pipeline
- Upcoming schedules and crew availability context
Role-relevant visibility
Dashboard data reflects the current state of the platform in real time. Managers see the full picture; field staff see their own upcoming work. The same data source feeds everyone without a separate reporting run or nightly export.
What the dashboard covers
- Job status distribution (open, in progress, completed)
- Invoice and payment activity
- Lead pipeline snapshot
- Recent quotes and their statuses
- Today's scheduled work and crew assignments
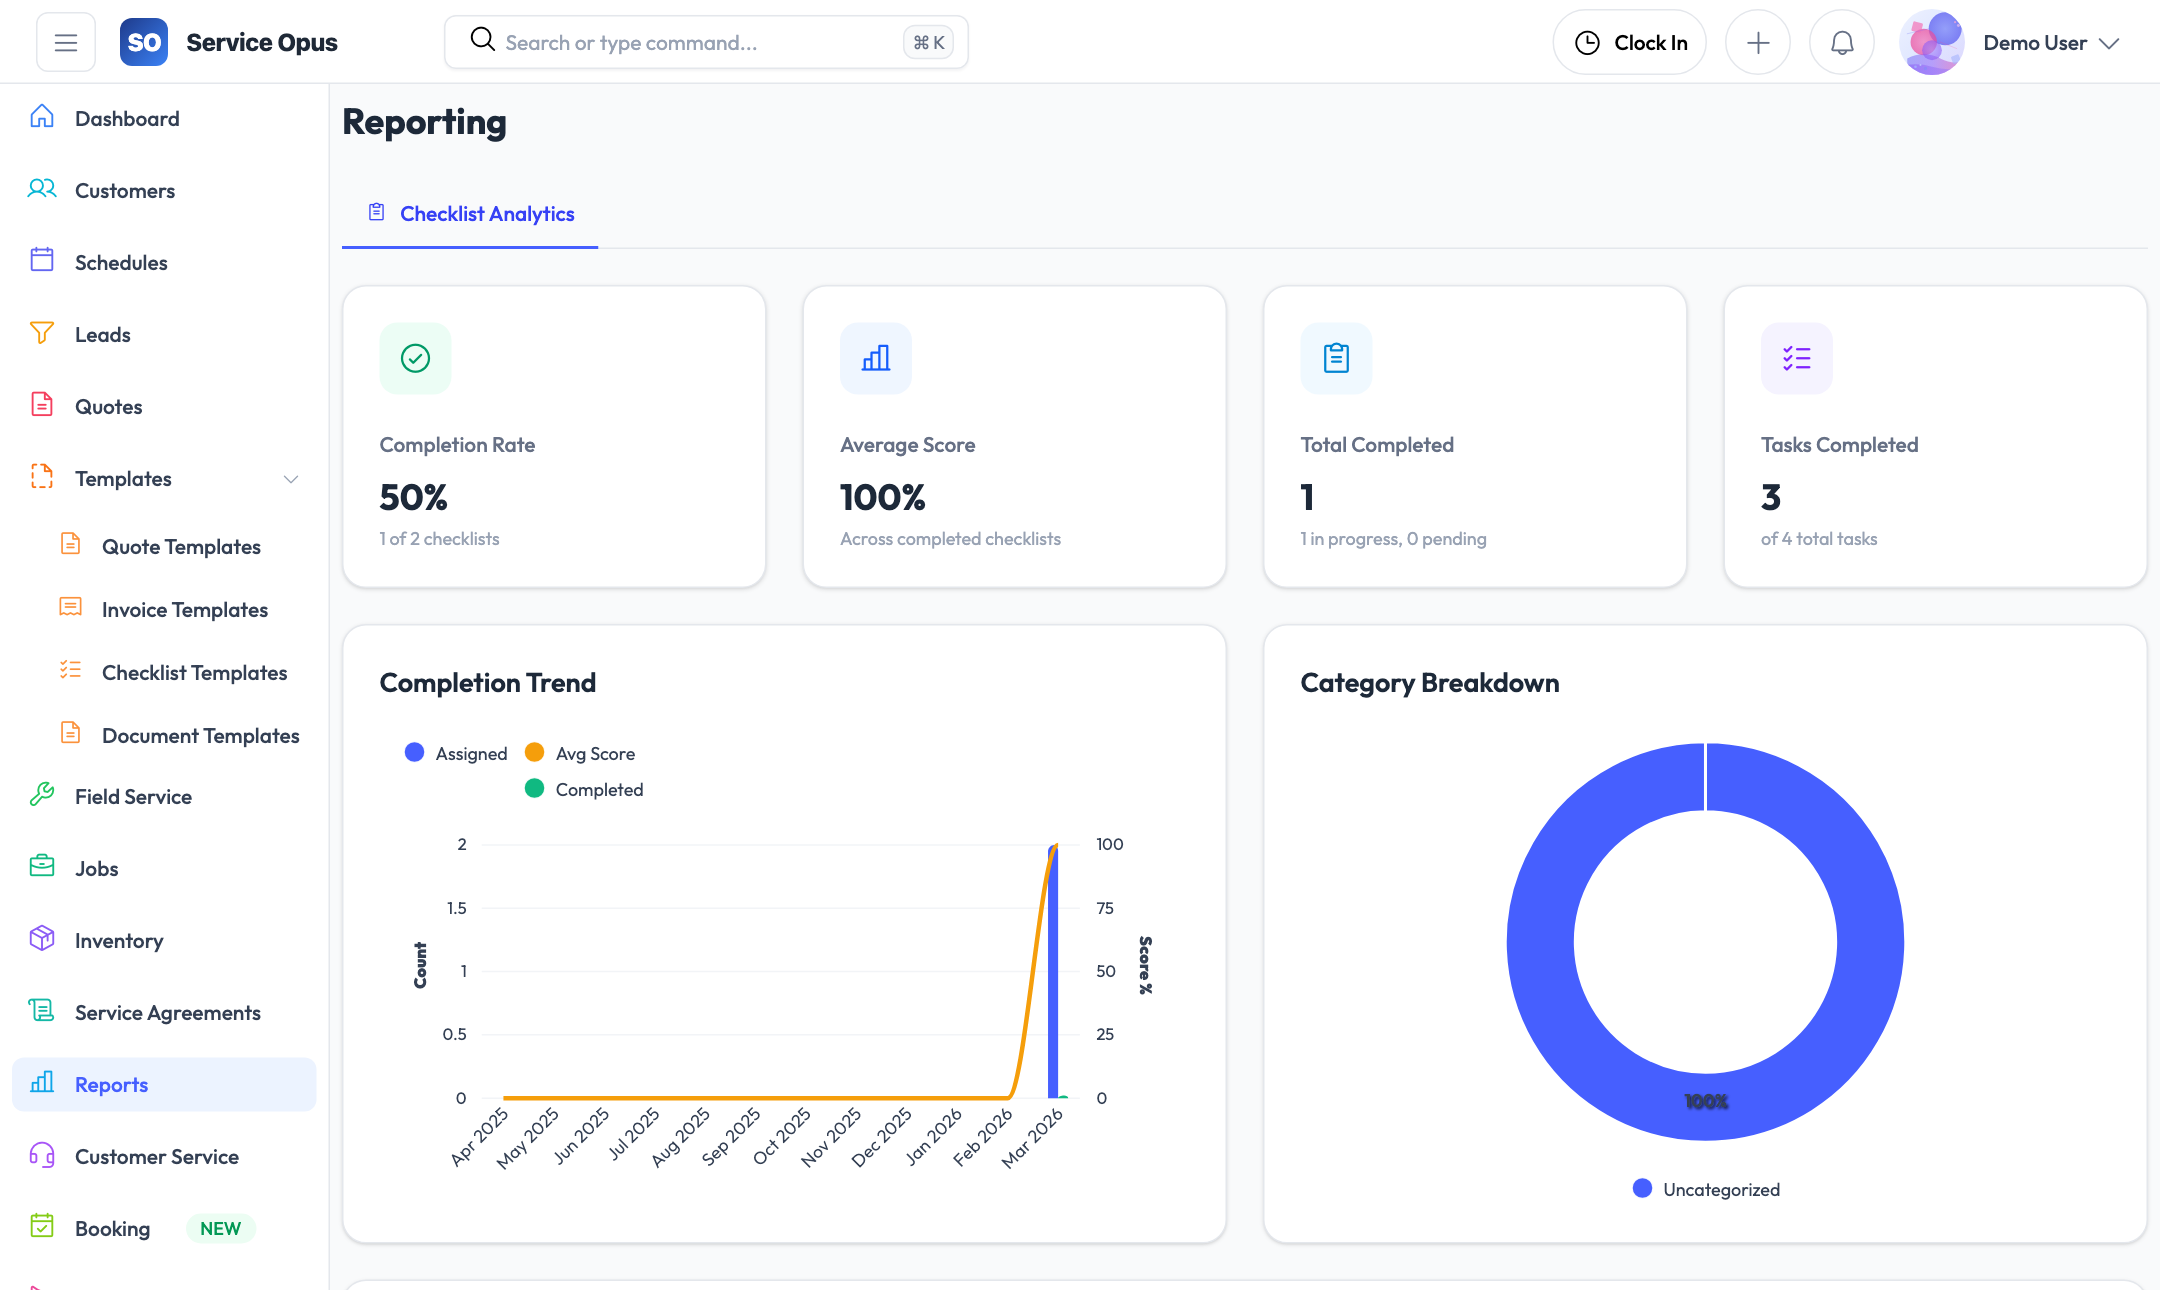
Analytics built into each feature area
Rather than a separate reporting module that is disconnected from the data, Service Opus embeds analytics directly into the relevant feature areas so the numbers are always in context.
Lead analytics
Track lead volume by period, conversion rate from lead to customer, average time to conversion, pipeline value by status, and source effectiveness — which channels produce the most closed work.
Quote analytics
Monitor quote count and value by status, acceptance rate over any date range, and how quickly quotes move from sent to accepted or rejected. Quote analytics help identify whether pricing or follow-up timing is affecting win rates.
Employee performance
Review each employee's job completion history, hours logged from time entries, and workload distribution over any date range. Performance data is computed from actual job assignments and time entries — no manual reporting input required.
Schedule analytics
Review scheduling patterns, crew utilization, and scheduling volume across the team. Understand whether the schedule is balanced and which employees are consistently over- or under-utilized.
Inventory reports
Review stock levels across all warehouses, usage history by item and category, and current inventory valuation. Inventory reports help identify slow-moving stock and items that need replenishment.
Inventory forecasting
The inventory forecasting module projects future demand based on historical usage patterns so you can place purchase orders ahead of anticipated need rather than reacting to stockouts.
Customer health and financial visibility
Beyond operational metrics, Service Opus surfaces the customer-level and financial-level data that owners and managers need for business decisions.
Customer health tracking
Each customer record carries health indicators — signals derived from job history, payment behaviour, and engagement — that flag accounts needing attention before they become problems. Customer health gives your team early warning of at-risk relationships rather than discovering issues after the customer has already left.
- Health status visible on the customer record and in list views
- Health signals based on job completion, payment patterns, and activity
- Filter the customer list by health status for targeted follow-up
Customer statements
Generate account statements showing all invoices, payment dates, and outstanding balances for any customer. Statements give your accounts team and the customer a clear, dated view of the financial relationship.
- Statement covers all invoices in the selected period
- Payment dates and amounts recorded per invoice
- Outstanding balance calculated across all open invoices
Customer analytics
The customer analytics tab on each customer record shows job history, invoice value over time, and payment patterns — the data you need to understand your most valuable customers and your highest-risk accounts without pulling a separate report.
Data that stays in context
Analytics in Service Opus are embedded where the data lives. You do not need to export to a spreadsheet to understand how a specific customer, employee, or lead source is performing — the numbers are on the relevant record.
- Customer analytics on the customer record
- Employee performance on the employee record
- Quote analytics in the quotes module
- Lead analytics in the leads module
- Inventory data in the inventory module
See it in action
Decisions based on data, not estimates
Every record in Service Opus contributes to the analytics picture. Try the full platform and see what your operational data actually looks like when it is all in one place.